Turn dead stock back into cash — and stop buying more of it
Every distributor has it: shelves of items that stopped selling, bought on a forecast that was never revisited. NextDemand shows how much cash is tied up in overstock, item by item and ranked by money, flags what has likely gone obsolete, and fixes the ordering that created it — so the next batch of dead stock never arrives.
Where dead stock comes from
- Orders sized to an average, not to the item. A one-off bulk order inflates the average, the reorder rule follows it, and the next delivery sits.
- Demand that faded quietly. An item drifts from monthly sales to none; nobody changes its min/max, so it keeps getting reordered.
- Long lead times, cautious buyers. When the next delivery is months away, ordering "a bit extra" feels safe — across hundreds of items it adds up to a warehouse of it.
The cost is more than the purchase price: carrying cost, warehouse space, write-downs, and the cash that could have bought the items that do sell. The free dead stock cost calculator puts a number on it.
How NextDemand finds it and fixes it
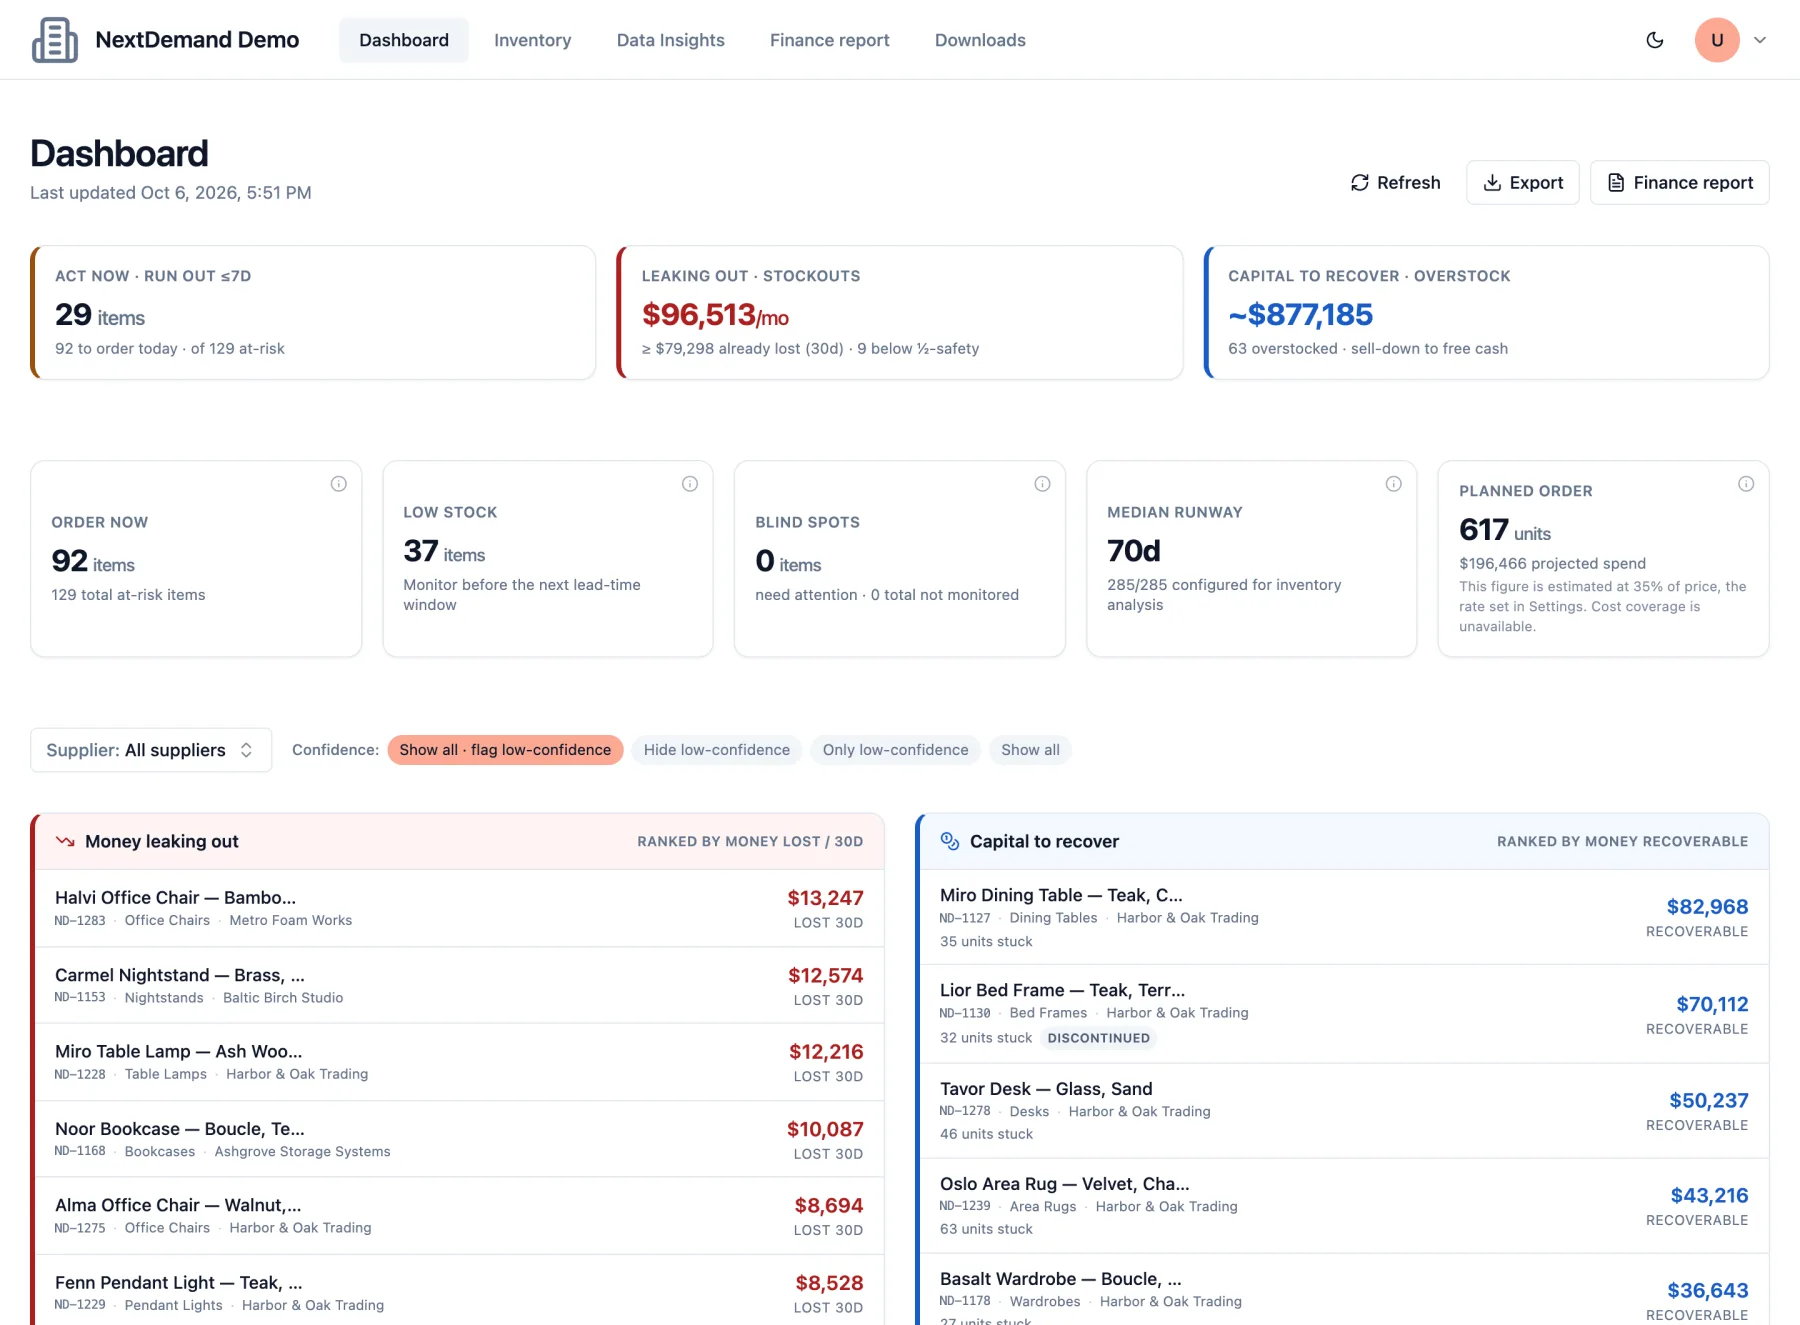
- Capital to recover, ranked by money. The dashboard lists overstocked items to sell down and the cash you can free by doing it, biggest first — not a 2,000-row report sorted by SKU.
- Likely obsolete, flagged. Items are grouped by how long since they last sold — recently, 1–2 months, 3–11 months, 12+ months — so the ones that have probably gone obsolete stand out. Mark an item obsolete and it stops generating reorder recommendations.
- No more reordering what does not sell. Each item is classified by its demand pattern and forecast with a method that fits, so a fading item's recommendation falls with its demand instead of following last year's average.
- A finance view. The one-page report for the CFO puts capital to recover next to sales lost to stockouts — the two sides of the same inventory budget.
What you need to start
Sales history per item and current stock, exported from your ERP or a spreadsheet; unit costs add the money view. Start on a single dataset — the overstock list is usually the first thing customers act on.
Frequently asked questions
What counts as dead stock?
Common definitions use time since the last sale — for example, nothing sold in 12 months. NextDemand groups items by recency of their last sale and separately flags overstock: stock well beyond what the forecast needs, even on items that still sell.
Does NextDemand sell the stock for me?
No. It finds the items and the cash, ranked so you know where to start; the sell-down itself — promotions, bundles, returns to supplier, liquidation — stays your decision.
Will it stop recommending orders for obsolete items?
Yes. Items you mark obsolete are excluded from reorder recommendations, and items whose demand is fading get smaller recommendations as their forecast falls.
Is it only for slow movers?
No. The same view shows the opposite problem — sales lost to stockouts on items that do sell — so cash freed from overstock can go where it earns.
See how much cash is on your shelves
Open the live demo — its dashboard shows the capital to recover on a sample company, no signup — or book a 30-minute demo on your own data.